Chapter 1 : The Cells of the CNS

Brain: Contents Page


Clinical Neurophysiology

Tests of nerve conduction are used to identify damage to a nerve trunk as a result of pressure or transection or neuropathy, to trace the extent of regeneration of axons, to examine the extent of denervation or re-innervation of skeletal muscle using Electromyography, and to study the integrity of pathways in the CNS using Evoked Potentials

Measurement of Conduction Velocity in Human Nerves

Clinical Neurophysiology Tests include

  1. the distal motor terminal latency of motor nerves
  2. the conduction velocity of the fastest motor nerve fibres
  3. the conduction velocity of the fastest sensory nerve fibres
  4. Evoked potentials that are used to study neural pathways in the CNS
  5. the examination of muscle using needle EMG electrodes that look for signs of denervation (fibrillation potentials) or reinnervation (large irregular motor unit potentials) - see the section on Electromyography.
  6. Electroencephalography (EEG), which examines the electrical rhythms produced in the cerebral cortex. This will be discussed in the section on Sleep and Arousal

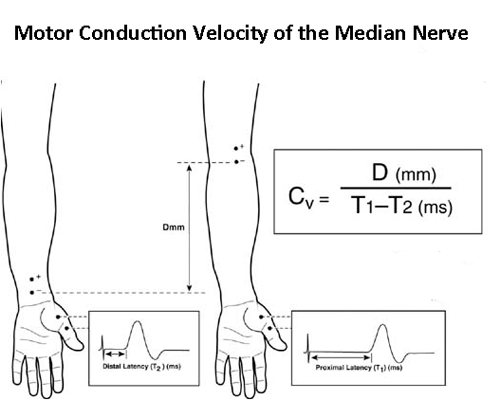
The first four in this list involve measurements of the conduction of action potentials in human nerves.

Tests of nerve conduction velocity are relatively simple to perform and give an indication about the condition of the fastest sensory or motor fibres in the nerve.

A commonly performed test to to examine the median nerve, as shown in the diagram.

Electrical stimuli are applied through the skin overlying the median nerve in the distal forearm, and again at the elbow.

Distal stimulation causes and action potential in the small muscles of the thumb, picked up by recording electrodes. The distal terminal latency is the time taken for the action potential to be conducted from nerve underlying the cathodal stimulating electrode to the nerve muscle junction plus the time taken to initiate the action potential in the muscles.

Proximal stimulation initiates a similar series of events but the proximal latency also includes the time taken for the nerve action potential to be conducted the distance between the two stimulating electrodes (wrist and elbow)- which happens to be approximately a straight line. So the conduction velocity of the median nerve in the forearm can be calculated as shown.


If the motor conduction velocity (CV) of the fastest fibres is >40 metres/second then the result is taken as normal. However, if the CV is <40 m/sec, the result is considered to be low and abnormal. It is important to be sure that a low result is not because the temperature of the limb nerve being tested is cold, because low temperature reduces the CV of peripheral nerves.

If the temperature is normal, and the CV is <40 m/sec, then it can be concluded that the nerve is abnormal, possibly due to neuropathies associated with disorders such as diabetes.

In the Carpal Tunnel Syndrome, pressure on the median nerve in the carpal tunnel causes the distal terminal latency to be greater than normal.

However the proximal part of the median nerve in the forearm is unaffected by the compression, and the CV in the forearm is unaffected.

Decompression of the carpal tunnel can return the distal terminal latency towards it normal value (<4.5 msec).

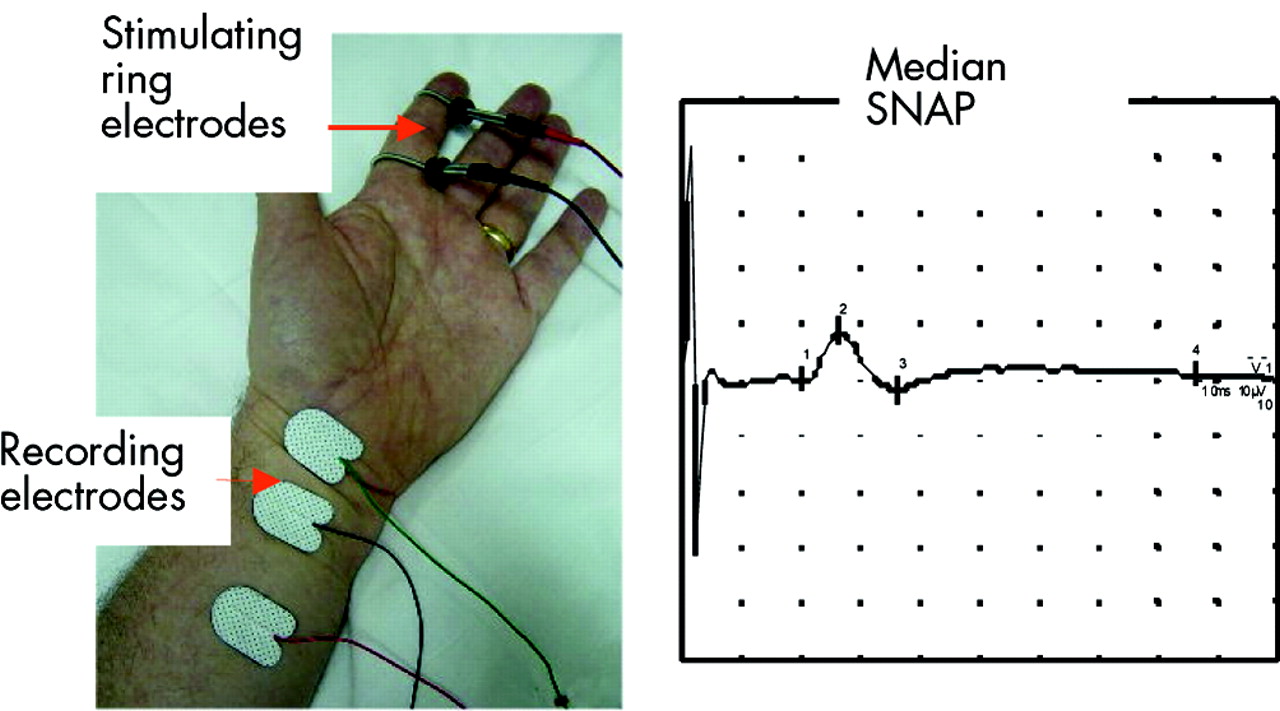
Sensory Nerve CV in the median nerve.

The conduction velocity of sensory axons can be examined by applying electrical stimuli to the nerve in the index or middle fingers (using ring electrodes), and recording a compound action potential from the median nerve in the wrist, using surface electrodes.

The conduction velocity is the distance between the cathodal stimulating electrode and the onset of the action potential, divided by the latency- expressed in metres/second. Because no synapses are involved, the distance between stimulating and recording electrodes, is divided by the latency of the sensory action potential. This is probably the most sensitive index of peripheral nerve function.

*

Other Nerve Compression Syndromes.

The ulnar nerve can become compressed at the elbow (student's elbow - the 'funny bone') , and the radial nerve may be affected by fractures of the humerus in the region of the radial groove.

In the lower limb, the common peroneal nerve can be compressed as it winds round the neck of the fibula, as a result of direct pressure of fracture of the bone.

The motor nerve tests in the lower limb are focussed on the flexor digitorum brevis muscle, which is innervated by the common peroneal nerve. Loss of control of this muscle results in footdrop.

Sensory testing in the lower limb examines the potentials generated in the sural nerve.

Neuropathies are disorders of peripheral nerves that give rise to symptoms such as pins and needles (paraesthesiae), pain and numbness in the periphery of the limbs.

Neuropathy can occur in metabolic disorders such as diabetes, or in nerve compression (say carpal tunnel syndrome),various infections and other aetiologies, and as a side effect of drugs.

There may also be signs of denervation of muscle (muscle wasting and loss of power)
Nerve Conduction is SLOWED in neuropathy: because of smaller axons, and loss of Myelin


www.hkma.org
Top

Electromyography (EMG)

Electromyography involves the recording of electrical signals from skeletal muscle using hypodermic needles that have a central electrode running down their centre and insulated from the outside of the needle. The potential changes between the muscle fibres in contact with the central electrode are measured relative to the surrounding tissue that is in contact with the exterior surface of the needle.

Normal skeletal muscle may have action potentials due to the resting tone of that muscle, and these are generated as a result of action potentials in the alpha motoneurones that innervate them. If the patient is asked to relax that muscle, these potentials (shown below) often disappear.

 *

Denervated skeletal muscle fibres produce some spontaneous electrical activity called fibrillation potentials: these are NOT action potentials, but smaller in size and duration and irregular in time and voltage. Unlike skeletal muscle action potentials they are not conducted along the length of the muscle fibre, but are loacl potentials.

Fibrillation Potentials are generated by denervated muscles cells and appear after the nerves to the muscle have degenerated at a time when the nicotinic receptors (normally confined to the post-synaptic membrane of the nerve-muscle junction) appear along the whole surface of the muscle fibre.

However the connection between these two events is not fully established.

*

The recording shows fibrillation potentials from a denervated muscle.

Reinnervation

When alpha motoneurones make contact with skeletal muscle fibres during the process of reinnervation, the contacts are not arranged in the original manner.

In a normal muscle the branches of the alpha motoneurones are distributed across a wide area of the muscle to innervate skeletal muscle fibres that are often separated by significant distances.

After reinnervation, the muscle fibres innervated by a single motoneurone tend to be close together: as a result a concentric needle electrode picks up potentials from several muscle fibres in the same 'new' motor unit.

The time of arrival of action potentials in the different muscle fibres being recorded is not simulataneous because of variations in the conduction velocity or length of the individual branches of the alpha motoneurone, and the site of the nerve muscle junctions.

The diagram shows some of this vatiation, and the electrical potentials being recorded from several musle fibres simulataneously. These motor unit potentials are large because of summation of potentials arising from different muscle fibres, and irregular because of the different times of arrival of the potenials at the electrode. However the irregularity in shape is constant, indicating that all the components arise from the same motoneurone.

The irregulatiy in shape also extends to the action potentials having peaks at different times, speak over a much longer time scale than one would expect normally, as shown below.

*

After regeneration of axons, a contact between the motoneurone and the skeletal muscle begins to function normally. The fibrillation potentials cease, and the expression of nicotinic receptors is again confined to the nerve muscle junction. The skeletal muscle produces action potentials.

Large Motor Unit Potentials. One of the changes that occurs after regeneration is the number of muscle fibres innervated by each motoneurone. Some motor units increase in size considerably.

Electromyography shows the action potentials to be large in size, and irregular (but constant) in shape, because the electrode picks up voltages generated in several neighbouring skeletal muscle fibres, each activated at different times, by the same motoneurone. Hence, in the diagram opposite, complex potentials are seen consistently, with some of the components being separated by up to several tens of milliseconds.


*

Sweep speed = 10 ms/div; Sensitivity = 1.0mV/div

EMG analysis of Disorders of the Nerve Muscle Junction

ElectroMyoGraphy (EMG) is an important investigation in the diagnosis of diseases of the nerve-muscle junction, such as Myaesthenia Gravis and the Eaton-Lambert Syndrome.

The basis method involves repetitive electrical stimulation of a superficial muscle nerve such as the median nerve above the flexor retinaculum or common peroneal nerve at the neck of the fibula, and recording of electrical activity from the muscles that are innervated by these nerves.

In a normal subject repetitive electrical stimulation always produces identical electrical responses from muscle to each stimulus.


In Myaesthenia Gravis the responses of the muscle get less with successive repeated stimuli. This is due to the abnormaities of the nicotinic recptor within the post-synaptic membrane in this condition.

In the Eaton-Lambert Syndrome, there are again abnormalities in nerve-muscle transmission, but in this condition the problem is in the release of the transmitter acetylcholine from the pre-synaptic membrane.


*

The recordings show the muscle EMG elicited during a repetitive burst of electrical stimulation of the motor nerve (at the vertical arrows). In myaesthnia gravis, the size of the muscle potential diminishes during the repetitive tran of stimuli, indicating a failure of transmission at the NMJ.

*

In myaesthenia gravis, the folds of the post-synaptic membrane are smaller and the number of nicotinic receptors on these membranes is also reduced, which explains the failure of neurotransmission.

yale.edu
washington.du
neuromuscular.wustl.edu
www.signal.uu.se
www.netemg.com
www.mmi.mcgill.ca
Top

Electroencephalography (EEG)

When electrodes are placed on the scalp, it is possible to record the rhythms of electrical activity in the underlying cerebral cortex - this is known as the ElectroEncephaloGram (EEG). There is international agreement on the placement of electrodes, and the potential difference between different electrodes is recorded as a series of waves ('brain waves') that relate to the electrical activity of the region of underlying cerebral cortex.

Electrodes over the occipital region record activity from the underlying visual cortex are particularly affected by changes in patterns of light falling on the retina.

The EEG is a sequence of brain waves that occur at different frequencies: a number of cycles per second
Alpha rhythm: 8-13 cycles/second
Beta rhythm: 13 cycles/second
Theta rhythm: 3.5-7.5 cycles/second
Delta rhythm:<3 cycles/second

The normal rhythm is the alpha rhythm, and consists of large amplitude waves when the eyes are closed. When the subject thinks or opens his eyes, the amplitude gets smaller and the waves of electrical activity become more frequent: this is the beta rhythm.

Theta and Delta rhythms are present during sleep, and the deeper the sleep the slower and larger are the waves.

Beta waves are observed in all age groups, are small in amplitude. Certain drugs, such as benzodiazepines, increase the frequency of beta waves.

The EEG undergoes changes on a daily basis, and is particularly affected by the sleep-waking cycle.

Sleep Architecture is an analysis of the EEG components present during sleep and is considered in the chapter on Sleep and Arousal. This chapter also contains links to a webpage on Sleep Disorders.

The waveforms of the EEG is due to the presence of rhythmical activity in the cerebral cortex that depends on neuronal circuits linking the cortex and the thalamus.

The activity is desynchronised by the ascending reticular activating system. Another phenomenon is Rapid Eye Movement Sleep, and the mechanisms underlying all of these changes in the EEG is discussed in the section on Brain Waves.


The EEG in the Diagnosis and Treatment of Epilepsy Clinical Aspects of Epilepsy
Pathophysiology of Epilepsy
Kindling

Top

Evoked Potentials

Visual Evoked Potentials; Somatosensory Evoked Potentials; Auditory Evoked Potentials; Transcranial Magnetic Stimulation

Methodology

Because of the spontaneous electrical activity of the cerebral cortex (EEG), the potentials generated from the visual cortex when there are changes in the pattern of light falling on the eye are superimposed on the EEG. Averaging computers are used to filter out the background 'noise' generated by the EEG; the computer can identify cortical waves of electrical activity synchronised with the visual stimulus, and the time taken for conduction of the impulses from the retina to the visual cortex can be calculated. The latency of the visual evoked potential is increased when there is damage to the myelin in the visual pathway, and these changes in the latency are used to identify some of the effects of multiple sclerosis on the visual system.

Similar evoked potentials in the respective areas of the cortex can be observed following electrical stimulation of sensory nerves (Somatosensory Evoked Potentials), or following clicks in the ear (Auditory Evoked Potentials).

To examine the integrity of motor pathways, magnetic stimulation of the cortex is used to measure the time taken for conduction from the motor cortex to muscles, where EMG electrodes are used to record the arrival of the impulses.

Visual Evoked Potential

If one records potentials generated in the occiptial lobe of the brain during repetitive visual stimulation, it is possible to record evoked potential changes which have characteristic latencies in normal people.

The commonest visual stimulus is a checkerboard in which the black squares are exchanged for white ones, and vice versa, while the subject's gaze is fixed on the centre of the board.

There is normally a positive potential at around 100 msec latency (called the P100 wave), and this wave is delayed if part of the visual pathway is affected by demyelination, as in multiple sclerosis (see the recordings below).

Visual stimuli directed to the eyes separately can reveal defects in one of the optic nerves. This is shown in the right hand diagram below, and the P100 wave is delayed in the left eye, because of optic neuritis, a common condition in multiple sclerosis, associated with transient loss of sight in one part of the visual field.

*


*


*

Transcranial Magnetic Stimulation

Transcranial magnetic stimulation (TMS) is a procedure that uses magnetic fields to stimulate nerve cells in the brain. An electromagnet is used to create electric currents that stimulate nerve cells in the region of the brain beneath the magnet.

TMS can excite cells in the motor cortex, and the time taken for conduction of nerve impulses from the motor cortex to the spinal cord and musculature, such as the small muscles of the hand can be measured.

*

An electromyographic response that was recorded while the subject was contracting a small hand muscle (first dorsal interosseous) to a single pulse of TMS at an intensity of 110% resting motor threshold. Approximately 20 ms after the stimulus is a large motor-evoked potential (MEP), followed by a period of relative quiescence of background EMG activity known as the 'cortical silent period'. The end of the silent period is indicated by the dashed vertical line.

*


www.nature.com
neurowiki2014.wikidot.com
webvision.med.utah.edu
library.med.utah.edu
tidsskriftet.net
Top

Brain: Contents Page

© HumanPhysiology.Academy 2014-2015